Products
Q▪Viewer - New MPLAB-X version will be available Jan 2014
Support for the MPLAB-8.x version of the Q▪Viewer will be discontinued in Jan 2014.
Q▪Viewer is an application that allows users to examine the state of the embedded program while debugging. Through the examination of this information, the user can analyze deadlocks, critical race conditions, programming errors, memory and processing logic. The Q▪Viewer is an excellent addition to any debug environment and is available for all full function Q▪Kernel Licensess V5.1 or later.
Q▪Viewer uses the memory map and the hex file to provide the user with detailed information not provided by competing products. Some of this information can be found under the general tab.
Not only version information is displayed but also the type of microcontroller, its memory details, the hardware resources used by Q▪Kernel and stack information. All Q▪Kernel timing is based on cycles. This is why the viewer can display such detailed information including how long the application has been running. The viewer always calculates all timing in cycles and µSec. Q▪Kernel uses two timing systems, one based on cycles and one based on the real-time clock (RTCC). If the RTCC is not set it will revert to the default Jan 1st 2000 date and time as pictured above.
The information that developers will likely find most useful is thread information. Q▪Viewer provides detailed information about the threads as shown below.
The above example shows a very simple program with two threads. Q▪Viewer displays both the name and function of the thread. This is possible because the Q▪Viewer compares the memory map file and the hex file with the debugger memory map. The total number of cycles as well as the relative percentage used is also shown. The sum of the percentages of the threads never add up to 100% because CPU time used by interrupts and fibers, including thread switching, is not in this total.
Another good example for detailed information is the timer tab.

The first thing noticed is the function name; competing products cannot show the name of a function, Q▪Viewer shows the name of the function as well as the object file. In the example above the timer does not have a name but the function called when the timer expires is __qq500mSec from object file “yRtcc1Lib2-elf.o”. This is the timer that emulates the RTCC and fires every 0.5 Sec. Q▪Viewer also shows amount of time before the timer expires.
All Q▪Kernel maintained memory is visible in detail in the Q-Viewer. The next example shows all memory pools in use and how much heap and EDS heap memory is available. EDS stands for Extended Data Space and is very common in the newer PIC-24 and dsPIC MCU’s. EDS is fully supported and allows the user to go beyond the 32kByte RAM limit.
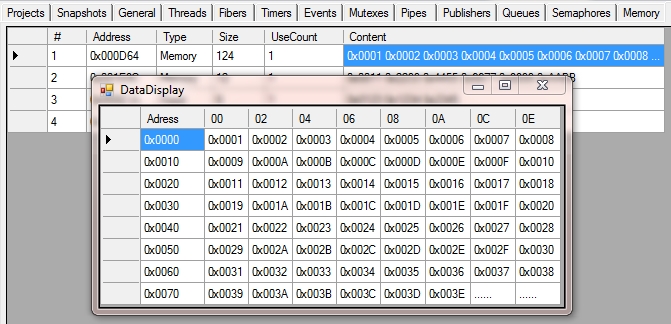
The Q▪Kernel message system is very powerful. It keeps track of the use count, this means that developers don’t have to manage them. The creator of a message sends the message to another thread and disposes the message. The receiver handles the message as its own. This mechanism is used to handle the publish-subscribe functionality. One of the columns in the message tab shows this use-count.
Other important information is the type of memory used, size and of course the content of the message. If the content cannot be displayed completely the user can click on the field and more detailed information as shown below:
Q▪Viewer also shows information about interrupts. This is very handy to check if interrupt handlers are set correctly and if there are no interrupt set without a handler. It also can detect the functions and whether the function is defined as weak.
Purchase Q▪Kernel-Pro Licenses and/or Pro support.
Download the latest release of the Q▪Kernel source code and documentation.
Get the answers to some common questions about Q▪Kernel
For Q▪Kernel-Pro support contact us.